Flip the Spectra
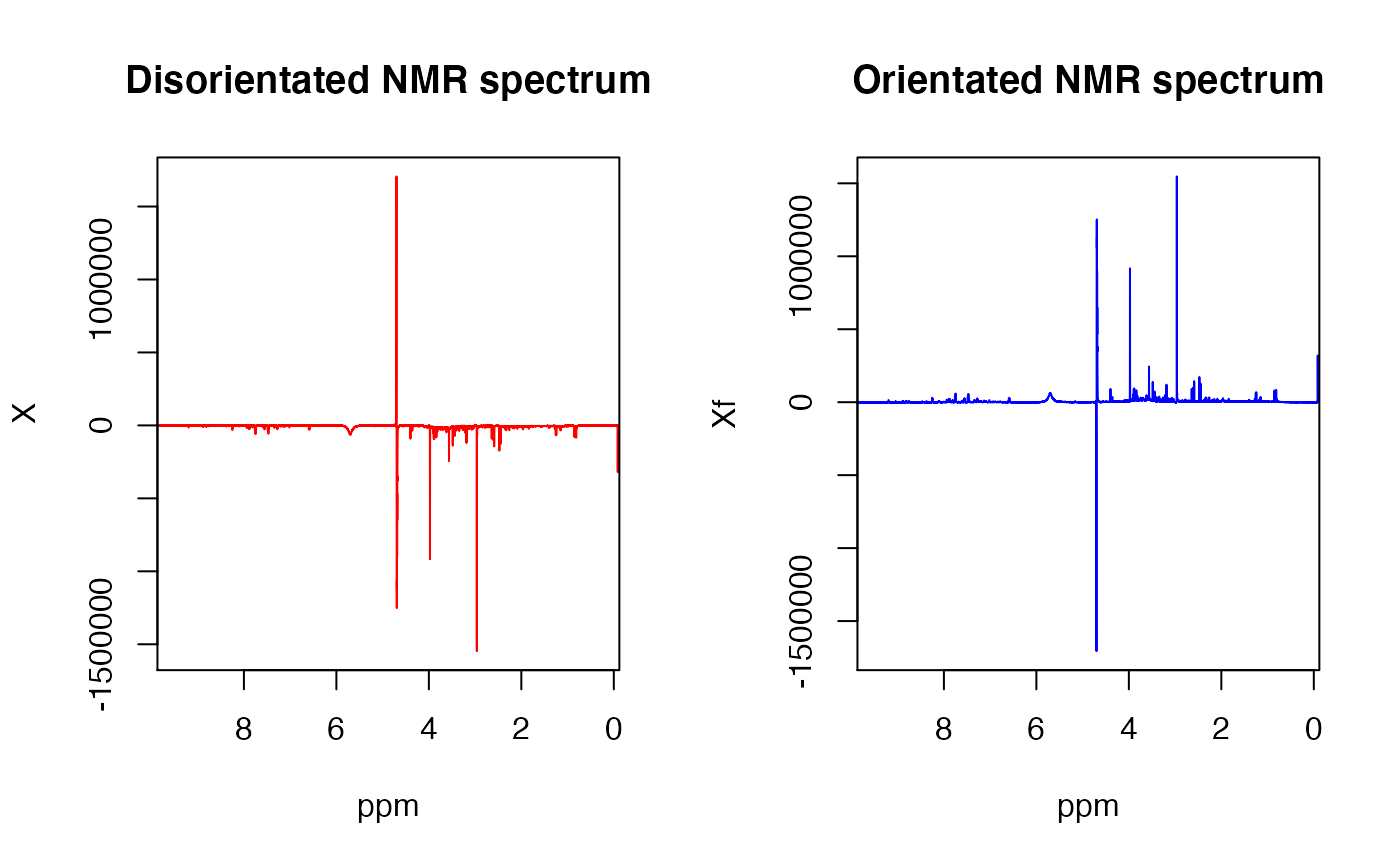
flip.RdSpectra produced from experiments with small scans can often appear upside-down. This function corrects this.
flip(X, ppm, sh = c(3, 3.1))
Arguments
| X | The numerical matrix containing the NMR data you wish to check for orientation. The rows must contain information of one whole spectrum and the columns contain the specific chemical shift variables. |
|---|---|
| ppm | An array of chemical shift variables. ppm should be column matched to the X matrix you are normalising. |
| sh | The concatenated ppm values that define the lower and upper bounds of the creatinine signal. Default is c(3,3.1) |
Value
Returns the original X matrix but with all values with the correct sign.
Details
NMR urine spectra that are produced from a small number of scans are often incorrectly orientated due to the water signal. This function looks at the creatinine signal (ppm = 3.05) which is in all urine spectra to see if the value is positive or negative. For negative valued spectra, they are mulitplied by -1 and flipped to the correct orientation.
See also
Other Data_Manipulation:
binin()
Author
Examples
read_in(path = system.file('extdata',package='concentr8r'),
        exp_type = list(exp=c("PROF_URINE_NOESY")),
        n_spec = 'multiple')
Xf <- flip(X, ppm)
par(mfrow = c(1,2))
plot(ppm,X[1,],type='l',xlim=c(9.5,0.25),
     col='red',main="Disorientated NMR spectrum",ylab="X")
plot(ppm,Xf[1,],type='l',xlim=c(9.5,0.25),
     col ='blue',main="Orientated NMR spectrum",ylab="Xf")
