Total Area Normalisation
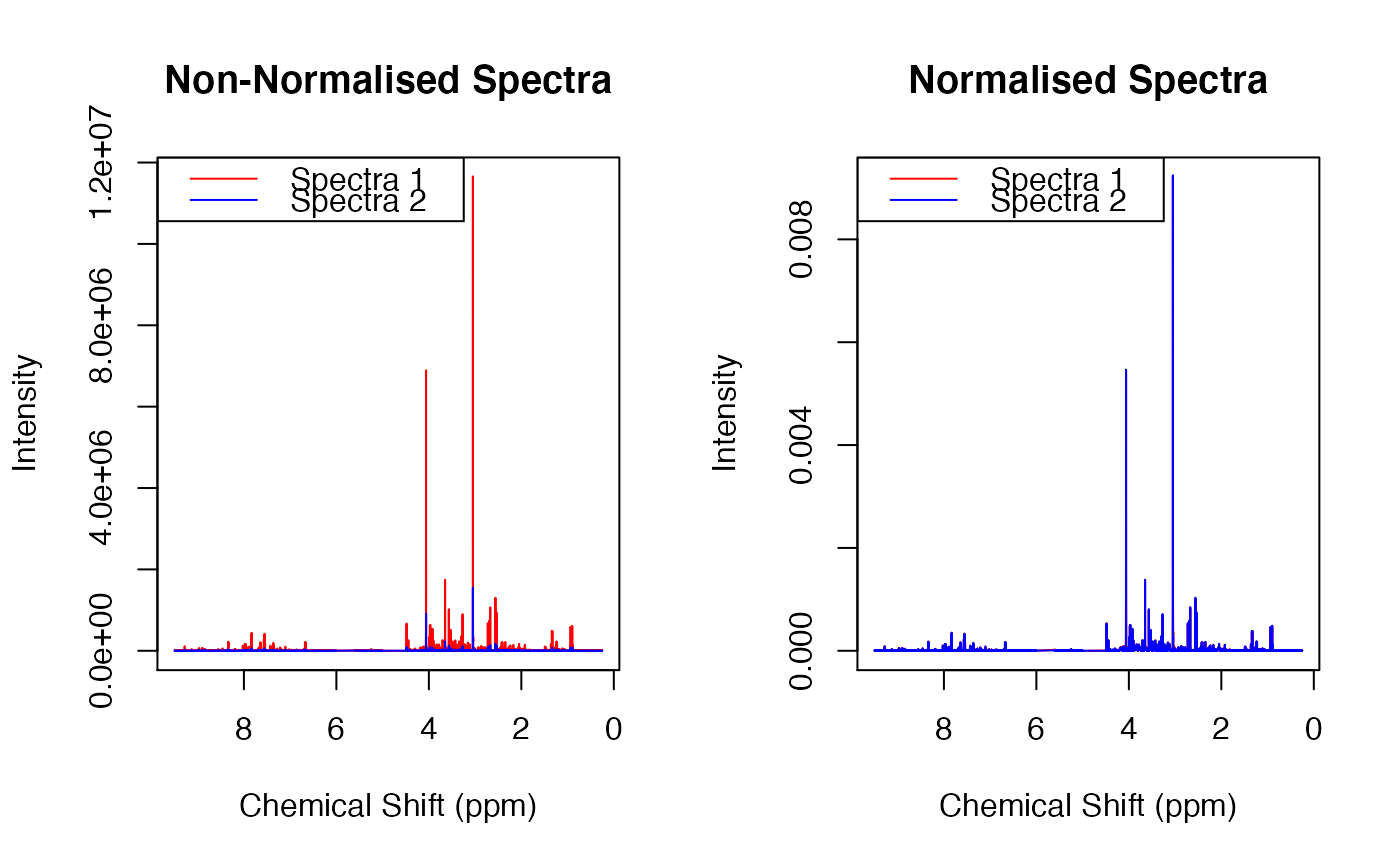
taNorm.RdTotal area normalisation (TA) scales spectra so that they all have a total integral of one
taNorm(X, noi)
Arguments
| X | The spectra intended to be normalised. Can either be a single spectrum in the form of a numerical array or multiple spectra in a numerical matrix with the rows being the spectra/samples and the columns being the ppm variables |
|---|---|
| noi | The noise estimation for each spectra given in an array that is row matched to the given X variable (i.e., for a single spectrum, only one noi value is required, for a matrix, the number of noi values should match the number of rows in X) |
Value
This function assigns the normalised X argument (as X_ta) and the calculated dilution factors (as dilf_ta) to the global environment.
Details
taNorm() works by summing all elements of a row (spectrum) and then dividing each element by this sum
See also
https://doi.org/10.1021/ac051632c
Other Attribute-Based:
creNorm(),
q1Norm(),
roiNorm(),
vecNorm()
Author
Examples
#> Calculating Dilfs... Done. #> Normalising X... Done. #>par(mfrow = c(1,2)) plot(ppm, X[2,], xlim = c(9.5,0.25), xlab = "Chemical Shift (ppm)", ylab = "Intensity", main = "Non-Normalised Spectra", type = 'l', col = 'red') points(ppm, X[1,], type = 'l', col = 'blue') legend("topleft", legend = c("Spectra 1", "Spectra 2"), col = c("red", "blue"), lty = 1) plot(ppm, X_ta[1,], xlim = c(9.5,0.25), xlab = "Chemical Shift (ppm)", ylab = "Intensity", main = "Normalised Spectra", type = 'l', col = 'red')#> 167611186 1260921231
